TL;DR
Most teams measure AI ROI too late and with the wrong metrics. Volume-based call stats don’t capture what AI actually changes. The right approach pairs leading indicators — metrics that move within weeks of deployment — with lagging indicators that confirm business-level impact over 60 to 90 days. This post gives you a practical framework for both, plus a starter dashboard you can build today.
Table of Contents
- Why do standard call metrics miss the point on AI ROI?
- Which leading indicators show AI impact first?
- Which lagging indicators confirm long-term AI value?
- How do you map KPIs to specific AI features?
- What does a practical AI ROI dashboard look like?
Introduction
Businesses are adopting AI features in their cloud communications platforms at a rapid pace. But many are struggling to answer the question that matters most to leadership: is it actually working?
The problem usually isn’t the AI itself. It’s the measurement approach. Teams default to the same dashboards they’ve always used — call volume, talk time, tickets closed — and then wonder why the numbers don’t reflect the transformation they feel on the ground.
AI ROI metrics for cloud communications require a different framework. You need metrics that capture what AI actually changes: how quickly agents resolve issues, how much after-call work disappears, how customer sentiment shifts over time. That means tracking both leading indicators (early signals, within weeks) and lagging indicators (business outcomes, within quarters). This post walks through both layers so you can build a measurement strategy that holds up to executive scrutiny.
Why Standard Call Metrics Mislead on AI ROI
Traditional contact center dashboards were built for a world where every variable in the system was human. They measure volume, speed, and availability — all reasonable things to track when your only tools are agents, scripts, and a phone queue.
But AI changes the underlying dynamics of a call. It surfaces information faster, reduces friction in handoffs, automates the work that happens after a call ends, and flags sentiment patterns that would take a supervisor hours to identify manually. None of that shows up in a calls-per-hour report.
This is the core measurement trap: if you evaluate AI against legacy KPIs, you will consistently undercount its impact. A 10% drop in total call volume might mean AI is deflecting simple inquiries — or it might mean customers are giving up. You can’t tell without the right supporting metrics.
The KPIs you choose to track are themselves a strategic decision. Measuring AI with the wrong instruments doesn’t just produce inaccurate results — it can actively mislead stakeholders into underinvesting in tools that are working or over-rotating toward tools that aren’t.
Before deploying any AI feature, align with your team on a short list of metrics you’ll use to evaluate it. Define the baseline. Set a measurement window. Then hold to it. The teams that get the clearest AI ROI picture are the ones that built their measurement framework before they flipped the switch — not after.
The sections below give you the specific KPIs to include in that framework, organized by when you’ll see them move.
Leading Indicators — The Early Signals of AI Impact
Leading indicators are the metrics that respond to AI deployment within days or weeks. They don’t tell you whether AI improved revenue or retention — that takes more time. But they tell you whether the technology is functioning as intended and whether agents are actually using it.
Track these in the first 30 to 60 days after any AI feature goes live.
Average Handle Time (AHT). This measures how long agents spend on each interaction from first contact through call wrap. AI reduces AHT in two ways: by surfacing relevant context before an agent needs to ask for it, and by automating the after-call documentation that follows every interaction. A McKinsey study of a 5,000-agent customer service operation found that generative AI reduced time spent handling an issue by 9 percent and increased issue resolution by 14 percent per hour. Reductions in AHT at that scale compound quickly across an entire contact center.
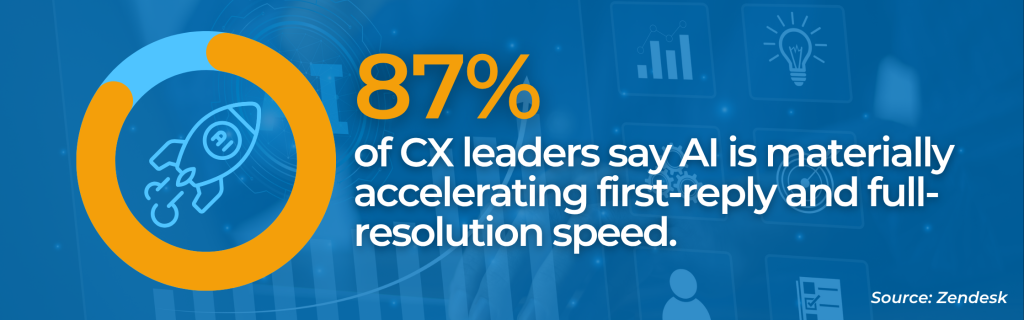
First-Call Resolution (FCR). FCR measures the percentage of customer issues resolved on the first interaction, without a callback or escalation. It’s arguably the most important single metric in any communications environment because it captures efficiency and effectiveness simultaneously. AI improves FCR by helping agents access the right information faster, by providing real-time guidance during calls, and by reducing the knowledge gaps that force customers to call back. Zendesk’s CX Trends 2026 report found that 87% of CX leaders say AI is materially accelerating first-reply and full-resolution speed — which makes FCR one of the clearest early indicators to watch. Baseline your FCR before any AI deployment — then measure it weekly.
Missed Call Rate This is the percentage of inbound calls that go unanswered. AI-powered routing and virtual agents can contain calls that previously fell through the cracks — especially outside business hours. A declining missed call rate within the first few weeks is often the clearest early proof point for AI-assisted call handling.
Agent Assist Utilization Rate This is a usage metric, not a performance metric — but it matters. If agents aren’t using the AI tools available to them, none of the other leading indicators will move. Track how frequently agents engage with AI-generated suggestions, knowledge prompts, or real-time coaching. Low utilization is a training and adoption problem, not a technology problem.
Lagging Indicators — Where AI ROI Shows Up on the Scorecard
Lagging indicators confirm that AI’s early operational gains have translated into durable business outcomes. These metrics typically take 60 to 90 days to reflect meaningful change — which is why teams that only measure at this layer feel like AI isn’t working, when in fact it just hasn’t had time to compound.
CSAT and NPS Customer Satisfaction scores and Net Promoter Scores are the clearest lagging signal of whether AI-driven operational improvements are translating into better customer experiences. They tend to move slowly and can be influenced by factors outside the communications stack — but a sustained, multi-quarter improvement in CSAT after an AI deployment is a strong indicator that the change is real. Segment CSAT by channel and interaction type so you can isolate which AI-assisted touchpoints are driving the improvement and which aren’t.
Agent Retention Rate Agent attrition is one of the most expensive line items in a contact center budget. Replacing a single agent typically costs 50% to 200% of their annual salary when you factor in recruiting, onboarding, and ramp time. AI reduces burnout by eliminating repetitive after-call work, surfacing answers agents would otherwise have to hunt for, and reducing the emotional weight of difficult calls through real-time sentiment guidance. Improved retention shows up slowly — but it’s one of the highest-value lagging signals available.
Cost Per Contact Cost per contact combines agent labor, platform costs, and call volume into a single efficiency metric. It won’t move until your leading indicators have had time to stabilize. But once they do, a meaningful AHT reduction across thousands of monthly interactions compounds quickly. This is the metric your CFO will care about most.
Revenue Per Customer In customer-facing teams with any sales or upsell motion, AI-assisted agents who spend less time on administrative tasks have more capacity to identify and act on revenue opportunities. Revenue per customer is a slow-moving metric, but it captures the full economic case for AI in a way that operational metrics alone cannot.
The most common mistake in AI ROI measurement is abandoning the evaluation before lagging indicators have had time to appear. Set a 90-day review window before you start — and don’t let short-term variance in leading indicators trigger premature conclusions.
Mapping KPIs to Specific AI Features
One of the clearest ways to build accountability into your AI measurement program is to assign each feature its own KPI owners. If a feature doesn’t have a metric attached to it, you have no way to evaluate whether it’s earning its place in the stack.
Here’s a practical mapping framework:
| AI Feature | Primary KPI | Supporting KPI |
|---|---|---|
| Call Summaries / Auto-Wrap | Average Handle Time | After-call work time |
| Agent Assist / Real-Time Coaching | First-Call Resolution | Agent utilization rate |
| Sentiment Analysis | CSAT score | Escalation rate |
| Conversation Intelligence | FCR | Agent quality score |
| Voice AI / Virtual Agent (IVR) | Containment rate | Missed call rate |
| AI-Powered Routing | FCR | Average speed of answer |
A few principles to guide how you use this framework:
One feature, two KPIs maximum. More than two KPIs per feature dilutes accountability and makes it difficult to isolate which variable caused which change.
Track containment rate separately from resolution rate. A virtual agent can contain a call without resolving it — meaning the customer never reached a human but also never got an answer. High containment and low CSAT together is a warning sign that your AI is deflecting rather than helping.
Watch escalation rate alongside sentiment. Sentiment analysis tools can flag calls where customer frustration is rising. The metric that tells you whether the system is acting on that signal is escalation rate — are at-risk calls reaching the right agent in time, or are they sitting in queue until the customer hangs up?
This feature-to-KPI mapping also makes it easier to have clear conversations with your technology vendors. If a vendor can’t tell you which specific metrics their feature is designed to move, that’s a meaningful data point.
Building a Practical AI ROI Dashboard
The temptation when building any analytics dashboard is to add everything you can measure. Resist it. A dashboard with 20 metrics produces noise. A dashboard with five produces decisions.
Here is a starter AI ROI dashboard for a cloud communications team in the first 90 days of AI deployment:
Leading Indicators (check weekly)
- Average Handle Time — track against pre-AI baseline
- First-Call Resolution rate — compare same period prior quarter
- Agent Assist utilization rate — flag if below 60%
Lagging Indicators (check monthly)
- CSAT score — segment by AI-assisted vs. non-AI-assisted calls where possible
- Cost per contact — calculate monthly against baseline
This five-metric set gives you early-warning visibility and business-outcome confirmation without requiring a data science team to operate it. Most modern cloud communications platforms surface at least three of these five natively.
A few implementation notes:
Establish your baseline before you turn anything on. A pre-deployment snapshot across all five metrics is the reference point every future data point will be measured against. Without it, you’re measuring change with no starting line.
Segment where you can. If your platform allows it, compare AI-assisted interactions against non-assisted ones side by side. This is the cleanest way to isolate AI’s contribution from other variables like seasonal call patterns or agent tenure shifts.
Set a formal 90-day review. Put it on the calendar now. Bring your leading and lagging indicators into the same room with the stakeholders who approved the AI investment. The teams that do this consistently are the ones that build the institutional confidence to keep investing — and the credibility to know when something isn’t working.
The goal of an AI ROI dashboard isn’t to prove AI is working. It’s to tell you specifically what is working, what isn’t, and where to focus next.
Ready to see these metrics move in your own business communications?
Crexendo VIP’s AI-powered features — including CAIRO, AI Call Summaries, AI Meeting Summaries, and Voice AI Studio — are built to surface the KPIs that matter, not just generate more data.
Schedule a personalized demo to explore how CAIRO, AI Call Summaries, AI Meeting Summaries, and Voice AI Studio can help your business.
Frequently Asked Questions
Leading indicators like Average Handle Time and First-Call Resolution typically show meaningful movement within 30 to 60 days of deployment, assuming strong agent adoption. Lagging indicators — CSAT, cost per contact, agent retention — generally take 60 to 90 days to reflect the compounding effect of those early gains. Plan your evaluation window accordingly before you deploy.
First-Call Resolution is the strongest single indicator. It captures routing quality, agent effectiveness, and knowledge accessibility in one number — all areas where AI has direct influence. FCR also correlates predictably with CSAT and NPS, making it a reliable proxy for customer experience outcomes even when those lagging indicators haven’t had time to move yet.
Yes. A five-metric starter dashboard — AHT, FCR, agent assist utilization, CSAT, and cost per contact — can be maintained by a single operations manager using native reporting in most modern cloud communications platforms. The key is establishing a clean baseline before deployment and committing to a 90-day review window before drawing conclusions.
Leading indicators (AHT, FCR, missed call rate) respond to AI deployment within weeks and tell you whether the technology is functioning correctly and being used. Lagging indicators (CSAT, agent retention, cost per contact) take 60 to 90 days but confirm whether operational improvements have translated into business outcomes. You need both — leading indicators alone don’t justify continued investment; lagging indicators alone don’t arrive fast enough to catch problems early.
Yes, meaningfully. In a CCaaS environment, AI ROI is typically measured through contact-center-specific KPIs — FCR, AHT, containment rate, agent utilization. In a UCaaS context, AI ROI shows up in productivity metrics: meeting summary adoption rates, reduction in after-meeting follow-up time, and collaboration efficiency. The leading-vs.-lagging framework applies to both, but the specific metrics in each layer differ based on where AI is being applied.